Telemetry
Hathora provides comprehensive telemetry to help you proactively monitor your servers and quickly diagnose live issues.
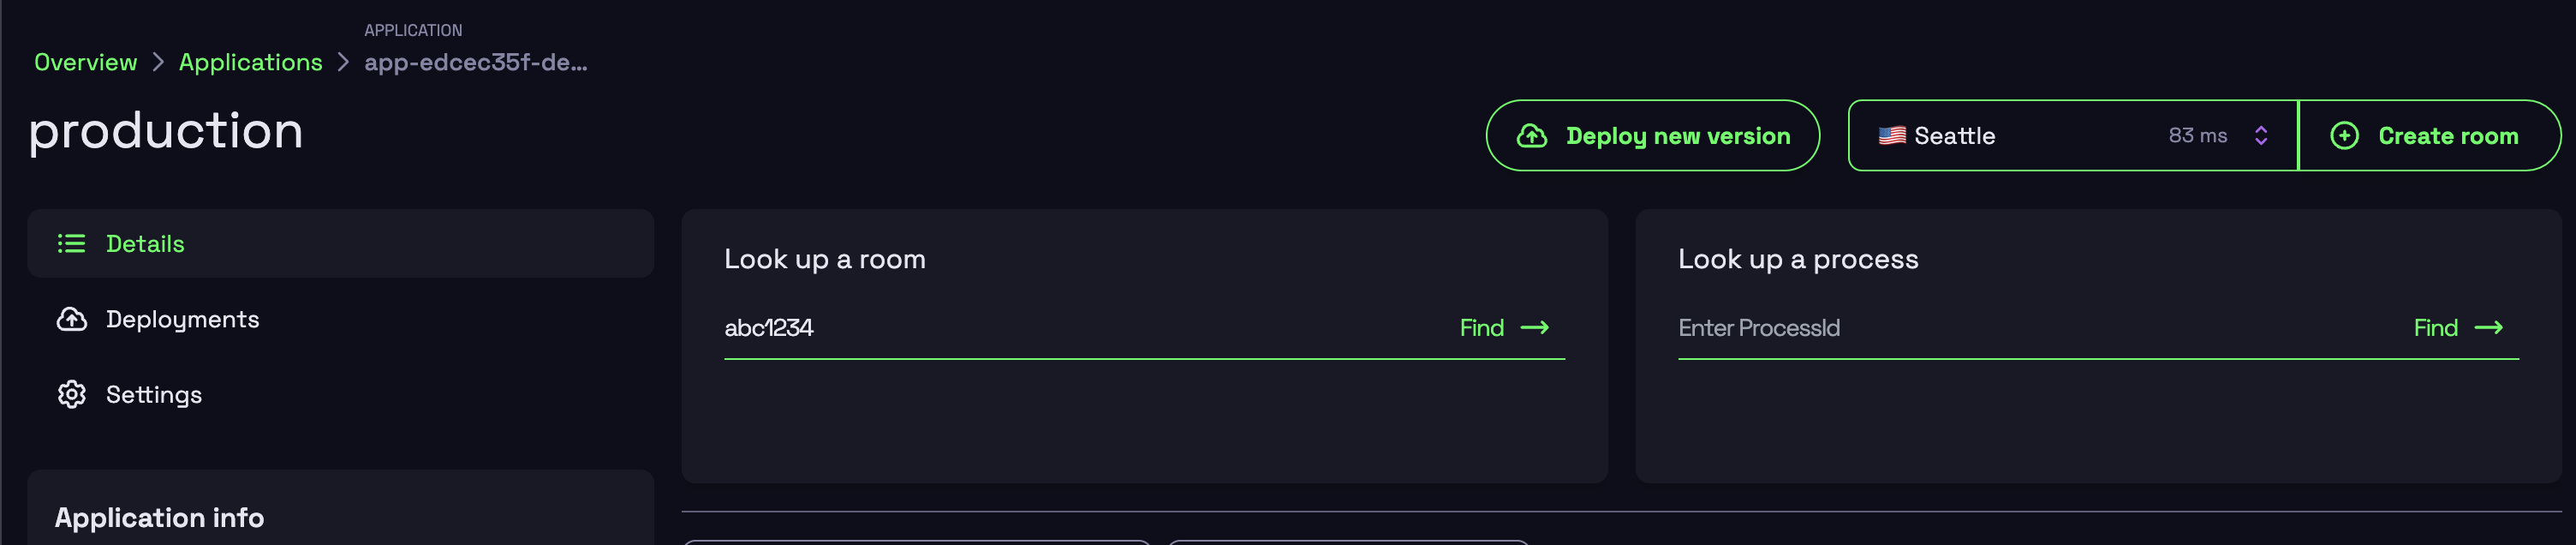
Process search
When creating a room in Hathora, you can specify an external match identifier, making it easy to look up a process using a matchmaker or backend system’s identifier. Use process search in:
- Hathora Console: Accessible from the Applications > Details page
- Hathora Cloud API: Use the GetRoomInfo endpoint
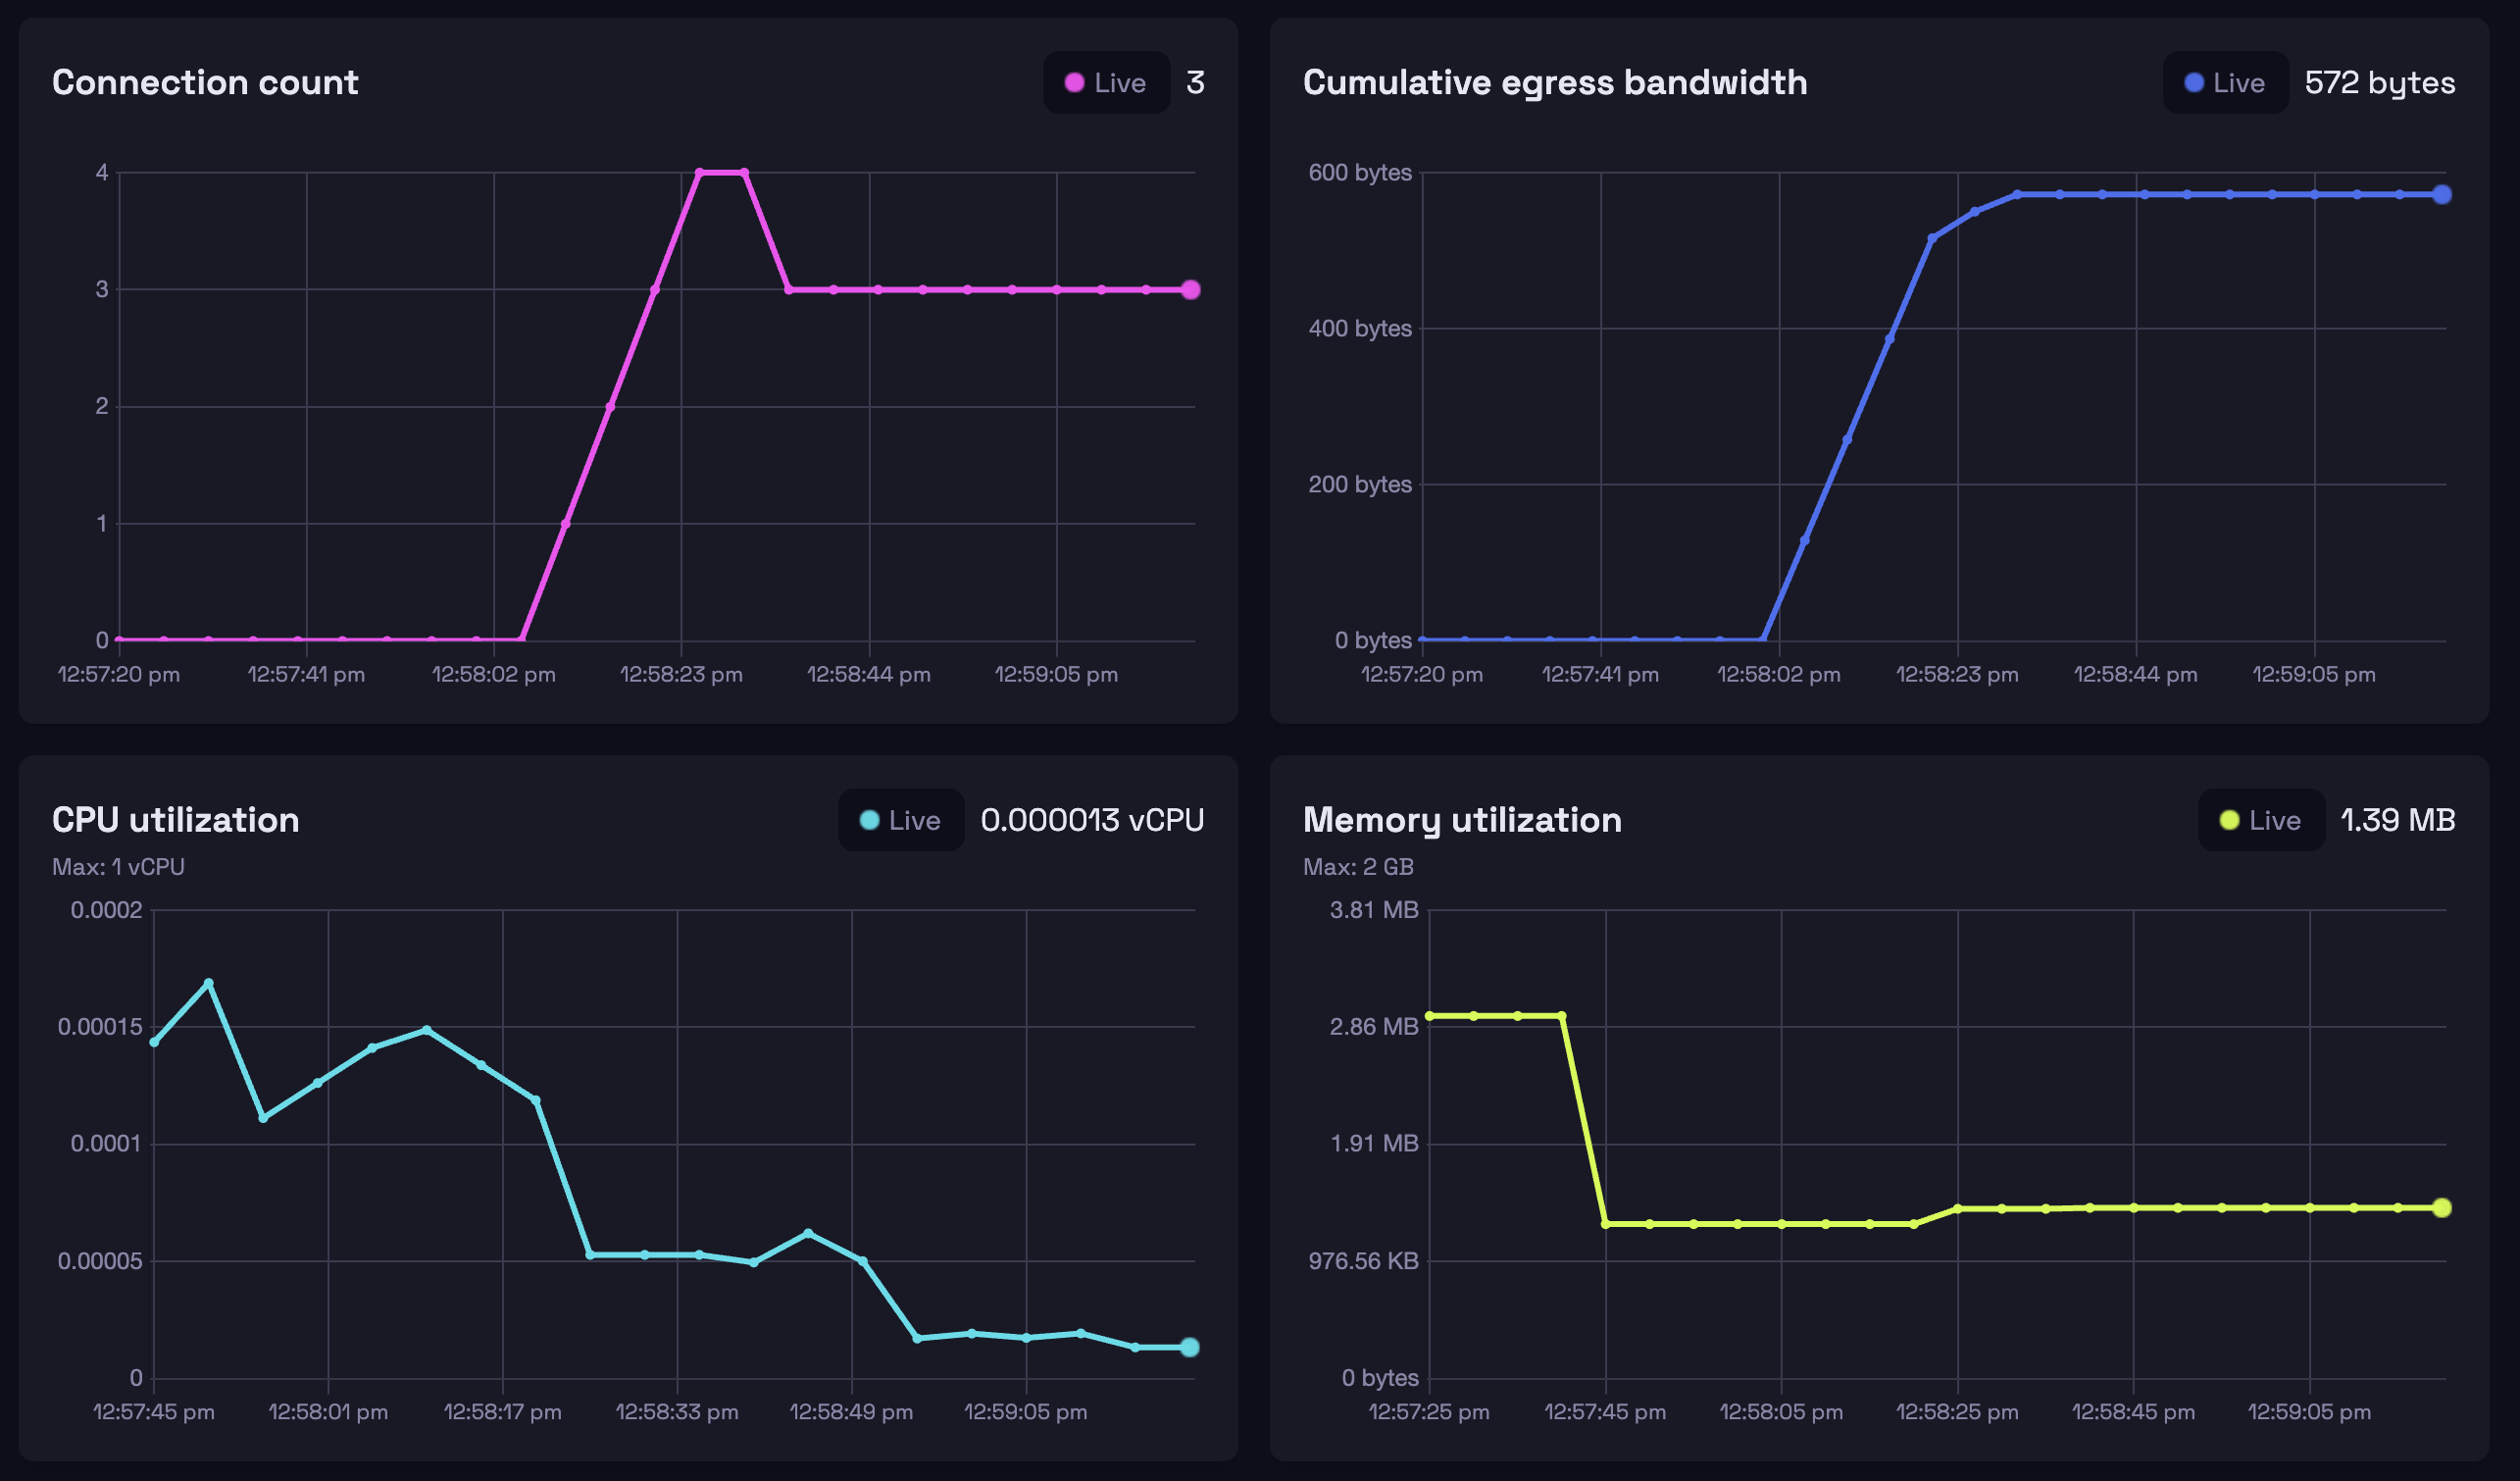
Metrics
Hathora collects and provides visibility into:
- Fleet utilization and autoscaler behavior: Monitor how infrastructure scales with demand by region
- Process-level resource and network usage: Fine-grained insights into running processes
Access metrics from the Console or via the API:
GetProcessMetricsGetFleetMetrics
Export metrics
For Enterprise customers, Hathora can export collected metrics to any Prometheus Remote-Write compliant endpoint, which helps integrate metrics from Hathora with those of external matchmakers and backends.
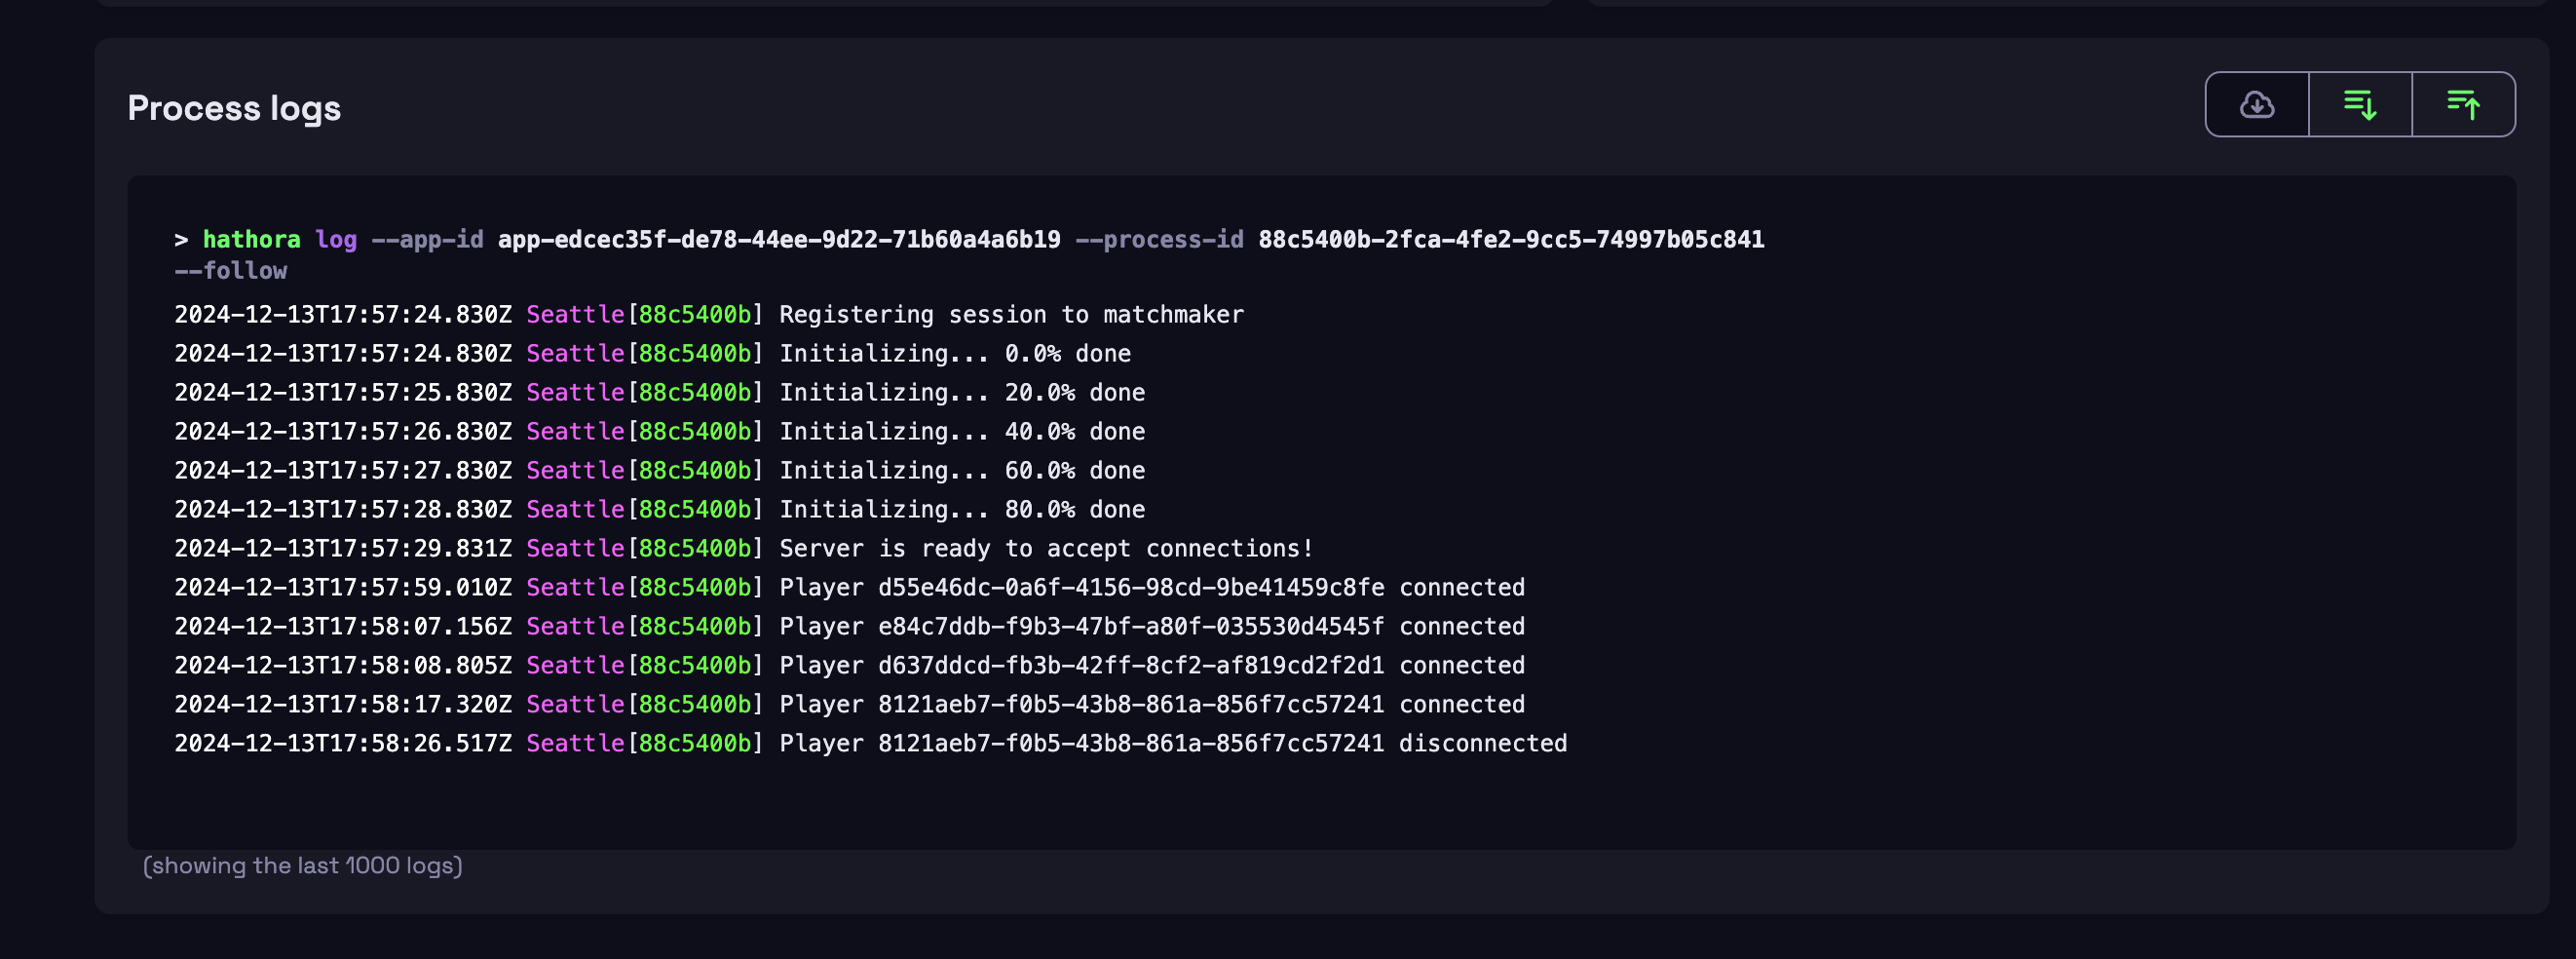
Logs
Hathora automatically captures stdout and stderr from all running processes.
Real-time tailing and downloading
Access logs for both active and stopped processes from:
- Hathora Console: Stream live logs for active processes or download logs for stopped processes
- Hathora Cloud API: Use the
Logsendpoints. - Hathora CLI: Use the
hathora logcommand. Learn more about the flags here.
Export logs
Developers can configure log exports using agents inside the container. Common destinations include S3, Datadog, and Honeycomb.
Retention
Hathora retains metrics and logs for up to 72 hours by default.
Enterprise customers can request for extended retention upon request,